Indexed Universal Life (IUL): less blue sky projections

Indexed Universal Life (IUL) illustrations commonly show 7% to 8+% returns based on historical averages over the last 20 to 30 years. Whether or not an Indexed UL can capture that kind of performance over the coming decades is debatable. 2008 bore an unsettling resemblance to 1929, except officials were able to spread foam on the runway.  The Euro’s instability lead to an additional dose of foam for European banks late last year.  All this uncertainty can make Indexed ULs more attractive because guarantees eliminate downside market risk while providing a life insurance benefit.  But what about the upside Certainly 2011’s index results surveyed were below average.  Tops was the Dow Jones Industrial Average at 5.53%.  The S & P 500, the most widely used index, came in at 0%, which is the floor for an Indexed UL regardless.  But then again, seeing blue sky, 2012 is off to a good start, and historically that’s a very good sign.

When reviewing an Indexed UL, it’s prudent to scenario the possibility of lower returns.  I ran a series of comparisons last fall on overfunding an Indexed UL to build cash value for retirement income.  Lincoln performed very well compared to the competition.   I used the S & P 500 Index, annual point-to-point, and Lincoln assumed on the illustration an 8.45% average return.

Over 8%?  How about 5%?
What would returns look like projecting at a more pedestrian 5%?   Assume a male, age 44, excellent health, putting in $25,000 a year in premiums for 20 years with the goal tax-free distributions for retirement income at age 65. Initial death benefit $520,000.

Carrier S&P 500
Index
Return
Cash Value
Year 20,
Age 64
Death
Benefit
Year 20,
Age 64
Retirement Income
Yrs. 21-40
Ages 65-84
Cash Value
Year 41,
Age 85
Death Benefit
year 41,
Age 85
 ‘
Lincoln 8.45%  $1,077,926  $1,597,926  $146,326  $830,516  $1,120,514
5.00%     $727,834  $1,247,834    $51,396 $219,059     $317,285

Take a different example with less premium.  $10,000 premium a year for 20 years: male, age 47, excellent health. Initial death benefit $185,000.

Carrier S&P 500
Index
Return
Cash Value
Year 20,
Age 67
Death
Benefit
Year 20,
Age 67
Retirement Income
Yrs. 21-40,
Ages 68-87
Cash Value
Year 41
Age 88
Death Benefit
year 41,
Age 88
.
Lincoln 8.45% $424,913 $609,913 $46,590 $186,833 $252,943
.
5.00% $287,005 $472,005 $19,732 $62,067 $77,698

When shopping for an Indexed Universal Life
All Indexed UL proposals come with full illustrations.  They’re required.  Brochures are okay as a start, but zero in on the illustration’s chart.  An agent can easily generate and email them on .pdf format.   Illustrations are based on current assumptions, for example 8.45% for Lincoln, but can be run with interest rate assumptions anywhere from 0% up to current.  Make sure to request and review lower interest rate assumptions as a counterpoint.

Carrier: Lincoln National Life Insurance Company; Product: ” Lincoln LifeReserve Indexed UL  (2011)”
Quotes run 1/11/2012 and are subject to change.

For your own personalized free quote please contact me.

Sean Drummey
Phone: (910) 328-04447
email: spdrummey@gmail.com

Surrender Charges on IUL

It’s always good to know the rules for getting money back, so I compared surrender charges for indexed universal life (IUL) carriers.  Surrender charges decrease on a declining schedule.  For the carriers I compared, it takes between 10 to 20 years for those charges to completely go away.  Not surprisingly, Lincoln and Penn Mutual were among those most favorable.

Penn Mutual is the best: no surrender charges after the 9th year, also no surrender charges in excess of target premium.

Target premium is a premium designed maintain a permanent policy for life.  Mind you target is a guidepost for keeping the policy in force, how the policy performs may require more or less premium.  With Indexed Universal Life one strategy is to over fund the policy above target to build additional cash value.  Of the carriers I surveyed, only Penn Mutual and Old Mutual did not require a surrender charge on that portion of the premium.

For example, as in prior comparisons: male age 44, over funding an Indexed UL with $25,000 in premium for 20 years in order to generate tax free retirment income in the form of policy loans.  With Penn Mutual this is a $590,000 increasing face amount policy, and the given target premium is $7,918 a year, but by over funding it with $25,000 in premium, just under the IRS limit for a Modified Endowment Contract (MEC), the policy builds the maximum permissible tax free cash value. That amount between $7,918 and $25,000 would not be subject to surrender charges at any time with Penn Mutual.

The least amount of surrender charges in the shortest period of time is a distinct advantage for an Indexed Universal Life in case there is a change in plans.

Sean Drummey
Contact for a free quote
Phone: (910) 328-0447
Email:  spdrummey@gmail.com

Indexed Universal Life (IUL) compared to a ship’s journey

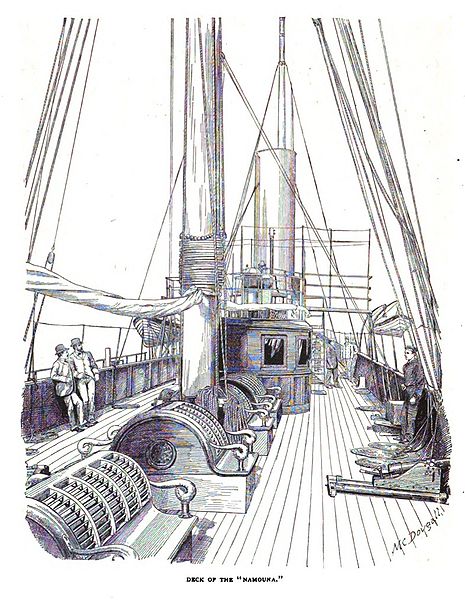
Think of IUL as a means to achieve desired goals: to build cash value and to provide a death benefit.  It is like going by yacht across the Pacific from California to Tahiti. This is a long journey, under many weather conditions, and this vessel is particularly designed to be safe and to reach its destination.

Prior to this life insurance that captured stock market, equity, returns was a more perilous journey.  Variable Universal Life, a VUL class yacht, was favored.  It is a sleek craft with the potential of performing very well (direct stock market participation), but like a yacht without an engine, it has proved to be risky for loss of cargo (cash value) and to capsize and sink (lapse).

So along came Indexed Universal Life as a safer alternative. It is like a powered yacht.  Call it a IUL class yacht.  She is backed by the ship builder (carrier) with no direct participation in the stock market.  She has a sail or multiple sails (Index Account).  Sails are designed for use when the winds are favorable (bull market) to build up the cargo (cash value) and ship’s value (death benefit).  If there is a typhoon (bear market) approaching, the ship’s owner can use the engine instead (Fixed Account).  If there are varying winds or doldrums, the owner may use both sail and engine (Participation Rate).  The owner must decide in advance which mode to use for a period of time (Segment).  This segment is generally one year.  When the segment is over, the yacht owner is awarded for its performance (Interest Rate Crediting ) that increases the value of the cargo (cash value) and yacht (death benefit).

Now this IUL yacht has a very sturdy deck (Floor).  Generally this deck is totally protected against leakage (0% market losses).  It may even a raised deck (1% or higher Floor).  As with a double hull, there are also guarantees in place for the ship not to sink (lapse).  These guarantees may be for a set period of time like 10 years, 20 years or for life.

There are, however, certain restrictions placed on the ship’s speed in favorable conditions.  The height of the mast is limited by the ship builder (Cap) or the top mast lowered (Spread).  The yacht owner may gain extra by increasing the volume of sail (additional premiums).   There are however certain rules as to how much sail is permitted (IRS rules for Modified Endowment Contract or MEC).

With an Indexed Universal Life cash value is built higher by increased premium contributions, and by gauging the direction stock market performance.  Ideally, when the market is in an upward trend, the owner has directed premium into a high performing index, and when the market is in a downward trend, premium is directed into a fixed account.  Regardless of choice or performance, the policy is protected against any losses by the floor.  It is similar to a powered yacht that sets the maximum amount of sail with favorable winds, and uses the engine when conditions are unfavorable.  There are various possible coverage goals.  Some may use an IUL for early cash value accumulation for retirement, others can use the cash value for premium payments in retirement and estate planning.

Keep in mind when reviewing Indexed UL products
Just as yacht makers may brag about the boat’s sails, engine and design, life insurance carriers will promote their Cap (e.g. 13%), Fixed Account guarantee (e.g. 3%), Floor guarantee (e.g. 1%) and other bonus features.   What is not evident is the product’s cost of insurance, expense and policy charges, the ship’s drag, how that affects the performance over a long period of time, especially 20, 30 or 40 years out.

How to Evaluate Competing Indexed UL Products
Fortunately, you don’t have to buy this IUL yacht after just reading the specs and trusting that it sails well.  Request from the agent a policy illustration to test the product’s projected future performance.  This will simulate how load and expense charges affect policy values, and compare that side-by-side with other carriers.  This will help determine the all important internal rate of return.  It’s similar to computer modeling a yacht race factoring each boat’s design, tonnage and various wind conditions.  The carrier’s financial strength and viability is another important consideration because cost of insurance and other expense charges are subject to change, and you are also selecting which carrier will perform best and deliver the best results over time.

Sean Drummey
Contact for a free quote
Phone: (910) 328-0447
Email:  spdrummey@gmail.com

Continue reading “Indexed Universal Life (IUL) compared to a ship’s journey”

Indexed Universal Life (IUL) comparisons for cash accumulation and retirement income

Here’s a side-by-side comparison of two Indexed Universal life (IUL) products with a focus on cash value accumulation and retirement income.  This post compares Lincoln National‘s  “Lincoln LifeReserve Index UL (2011)”  to North American‘s “Rapid Builder IUL”.   North American in my prior comparison outperformed Minnesota Life and John Hancock’s IUL products.

I will not give here a detailed look and the product features of each IUL, as for example, Lincoln’s cap on its 1 Year Point-to-Point is currently 13%.  I will focus on the projects results of where affected by their internal rate of return, how the fees and expense charges affect the policy, assuming as much as possible apples-for-apples comparison: same death initial premium and death benefit.  North American assumes a 8.30% return on its S & P 500 point-to-point; Lincoln assumes 8.45%, so these policies run fairly close in their assumptions.  For an agent or a prospective buyer, reviewing full illustrations to see how this internal rate of return affects the policy in 20, 30 and 40 years, and by comparing values side-by-side with competing carriers is a very useful analytical tool.

Here are the assumptions:

44 year old male, best health rate, puts in $25,000 a year premiums for 20 years, then no further premium contributions.  Structure minimum death benefit, here a starting face amount of $538,923, and still qualifying at tax advantaged life insurance under IRS rules for a modified endowment contact (MEC).  In the next 20 years draws out the maximum in loans, which are not subject to taxation, for retirement income, and still target a $100,000 death benefit at age 120 or over.  The index is S & P 500 annual point-to-point.

Each quote comes with a full illustration that charts a lifetime of policy values year by year.  Here are some benchmarks for comparison:

Age 64                        (year 20):                cash value accumulation
Age 65 to age 84         (years 21-40)           retirement funds, i.e. policy loans
Age 85                        (year 41)                 death benefit amount

Carrier Cash Value
Year 20
Death Benefit
Year 20
Loan amount
Years  21 – 40
Cash Value
Year 41
Death Benefit
Year 41
 Lincoln  1,072,791  1,611,714  145,602  826,476  1,115,403
 North American  1,144,104  1,683,042  147,248  658,775     981,056

What became noteworthy and crucial in the comparison were the loan rates and rules of each plan.  North American offers a choice of loans at a fixed or variable rate.  The variable rate is based upon Moody’s monthly bond average yield , which for October, 2011 was 4.60%.   North American, presumably because the current rate is historically low, assumes by default a 5.60% rate for quotes, which I also used here.  This run down will give you a look how the rate has changed over the last century.  North American’s rate has a 4.00% floor and a 10.00% cap on their variable loan rate.

Lincoln had only one option a guaranteed fixed rate: 6% for policy years 1 – 10, and  5% for years 11 to age 100.  What was noteworthy is how strongly the fixed rate returns performed against the variable rate.  Other carriers including North American offer a fixed rate loan option but the loan payout numbers are not nearly as good as Lincoln’s.    (Also interesting to note Lincoln had an option for the loans/withdrawals to be monthly, quarterly, semi-annual or annual, and the loans values were higher selecting the monthly option.)

For cash value accumulation strategy and to use policy loans for retirement income, the parameters of this comparison, Lincoln has a more favorable IUL product than North American.   It would generally be much preferable to lock in a well performing fixed rate over the span of decades than be subject to downside risks of fluctuating rates.

For example,  compare Lincoln fixed loan rate to North American with changes to the loan rate:

$145,602     5.00%  fixed rate  Lincoln

$147,248     5.60%  variable rate North American
$130,920     6.60%
$124,853     7.00%
$110,775     8.00%
$92,123       9.00%
$70,351      10.00%   maximum

$107,777    fixed rate Standard Policy Loan option North American

As you can see, North American variable loan rate would have to consistently stay at or below 5.60% in order to outperform Lincoln.   That’s unlikely.

Carriers & Products:

Lincoln National Life Insurance Company:  “Lincoln LifeReserve Indexed UL  (2011)”
North American Company for Life and Health Insurance:  “Rapid Builder IUL”

Image source: Wikipedia Commons

Disclaimer:  Quotes were revised on 11/22/2011, and are correct and accurate to the best of my knowledge. Product features and rates are subject to change.  Please contact the carriers directly for full details on these products reviewed.  Tax information is general information only. Please seek professional tax advice for personal income tax questions and assistance.

Indexed Survivorship Life Insurance

Indexed Survivorship Universal Life increases the upside cash value potential by having interest indexed to equities.  No money is actually invested in equities, so there is less downside risk, as with variable universal life.

Compared here is Prudential,  the most competitive guaranteed survivor universal life (GSUL) at age 65, verses North American’s Survivorship GIUL , guaranteed indexed universal life.

Continue reading “Indexed Survivorship Life Insurance”